
Mechanical Ventilation Simulator
User Manual
rogerstedman.com
Introduction
VentSim is a real-time mechanical ventilation and respiratory physiology simulator designed for clinical education and training. It runs entirely in your web browser with no installation required, and is optimised for both desktop and mobile devices.
VentSim models the complete physiological interaction between a mechanical ventilator and a patient’s respiratory system — including lung mechanics, gas exchange, and blood gas analysis. It is intended to help clinicians, trainees, and students develop intuition for ventilator management across a wide range of clinical scenarios.
The simulator is available in two tiers:
- VentSim Free — real-time waveforms, pressure-volume and flow-volume loops, full ventilator control, and lung mechanics adjustment.
- VentSim Pro — adds the complete gas exchange model, arterial blood gas sampling, SpO₂ and ETCO₂ monitoring with alarm states, alveolar ventilation display, and clinical scenarios.
The Interface at a Glance
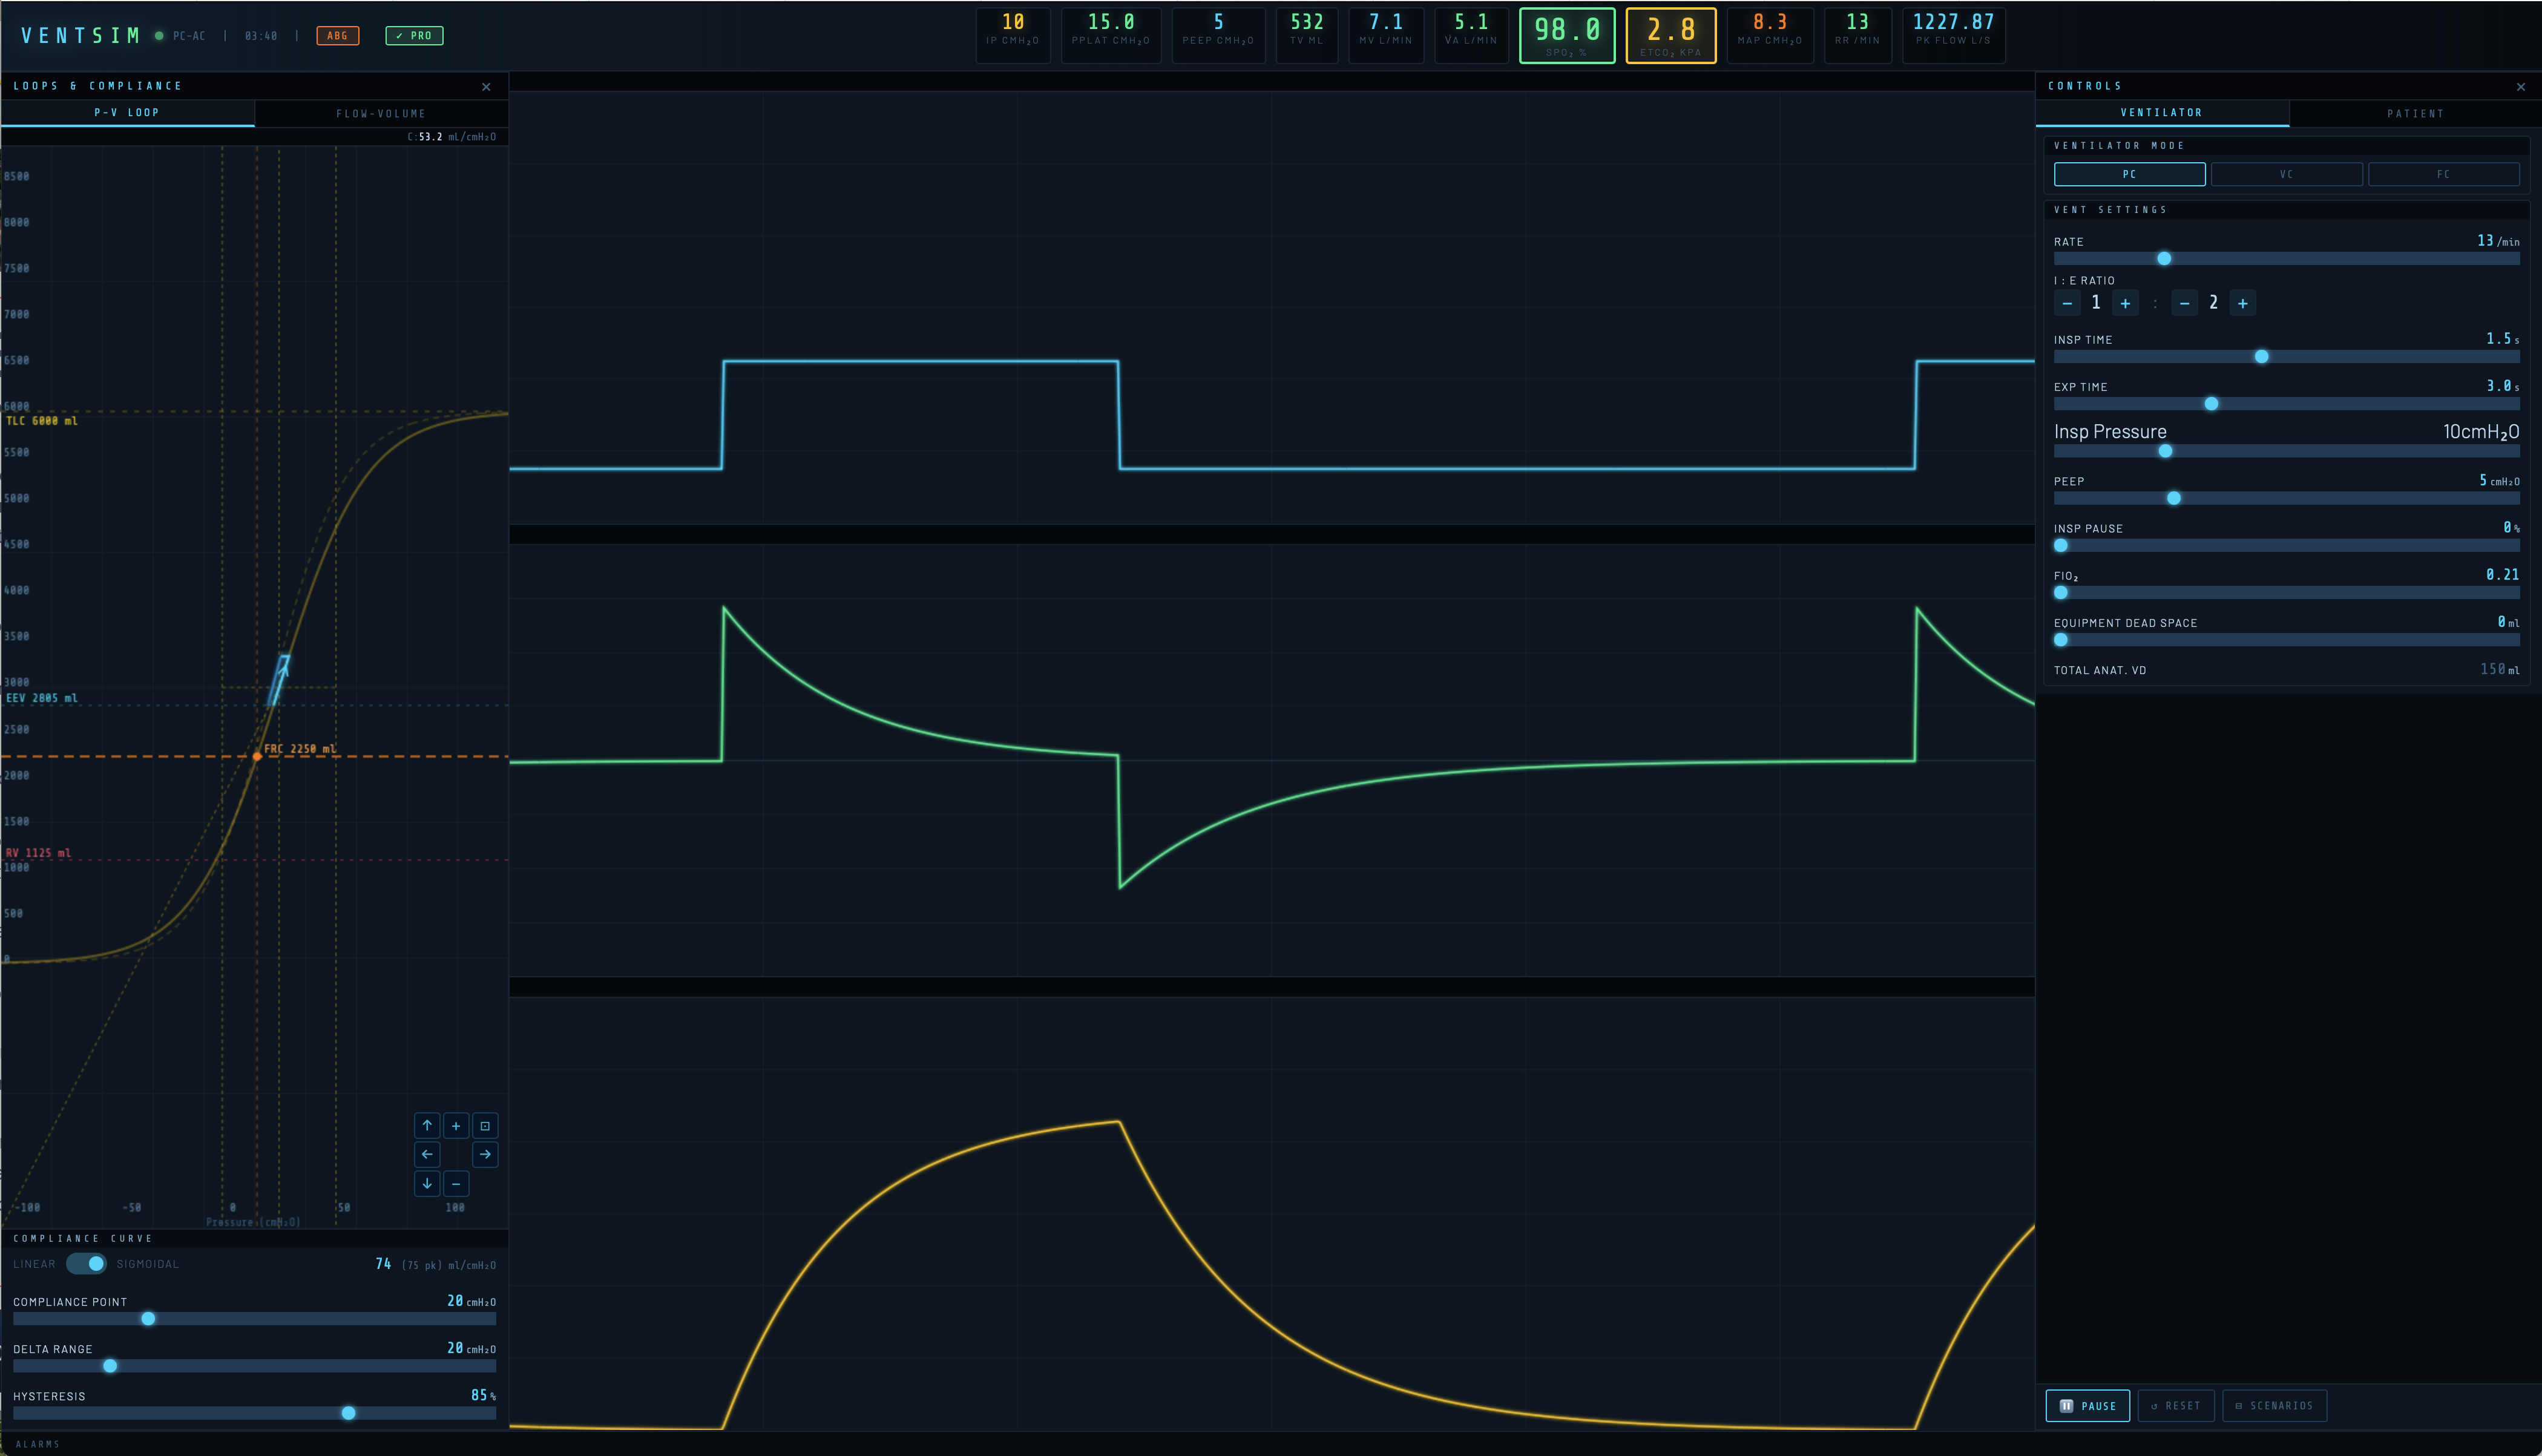
The screen is divided into three main areas:
Header strip — runs across the top of the screen and displays key monitored values. The ventilation mode, elapsed time clock, and control buttons (ABG and PRO) sit alongside the VentSim logo.
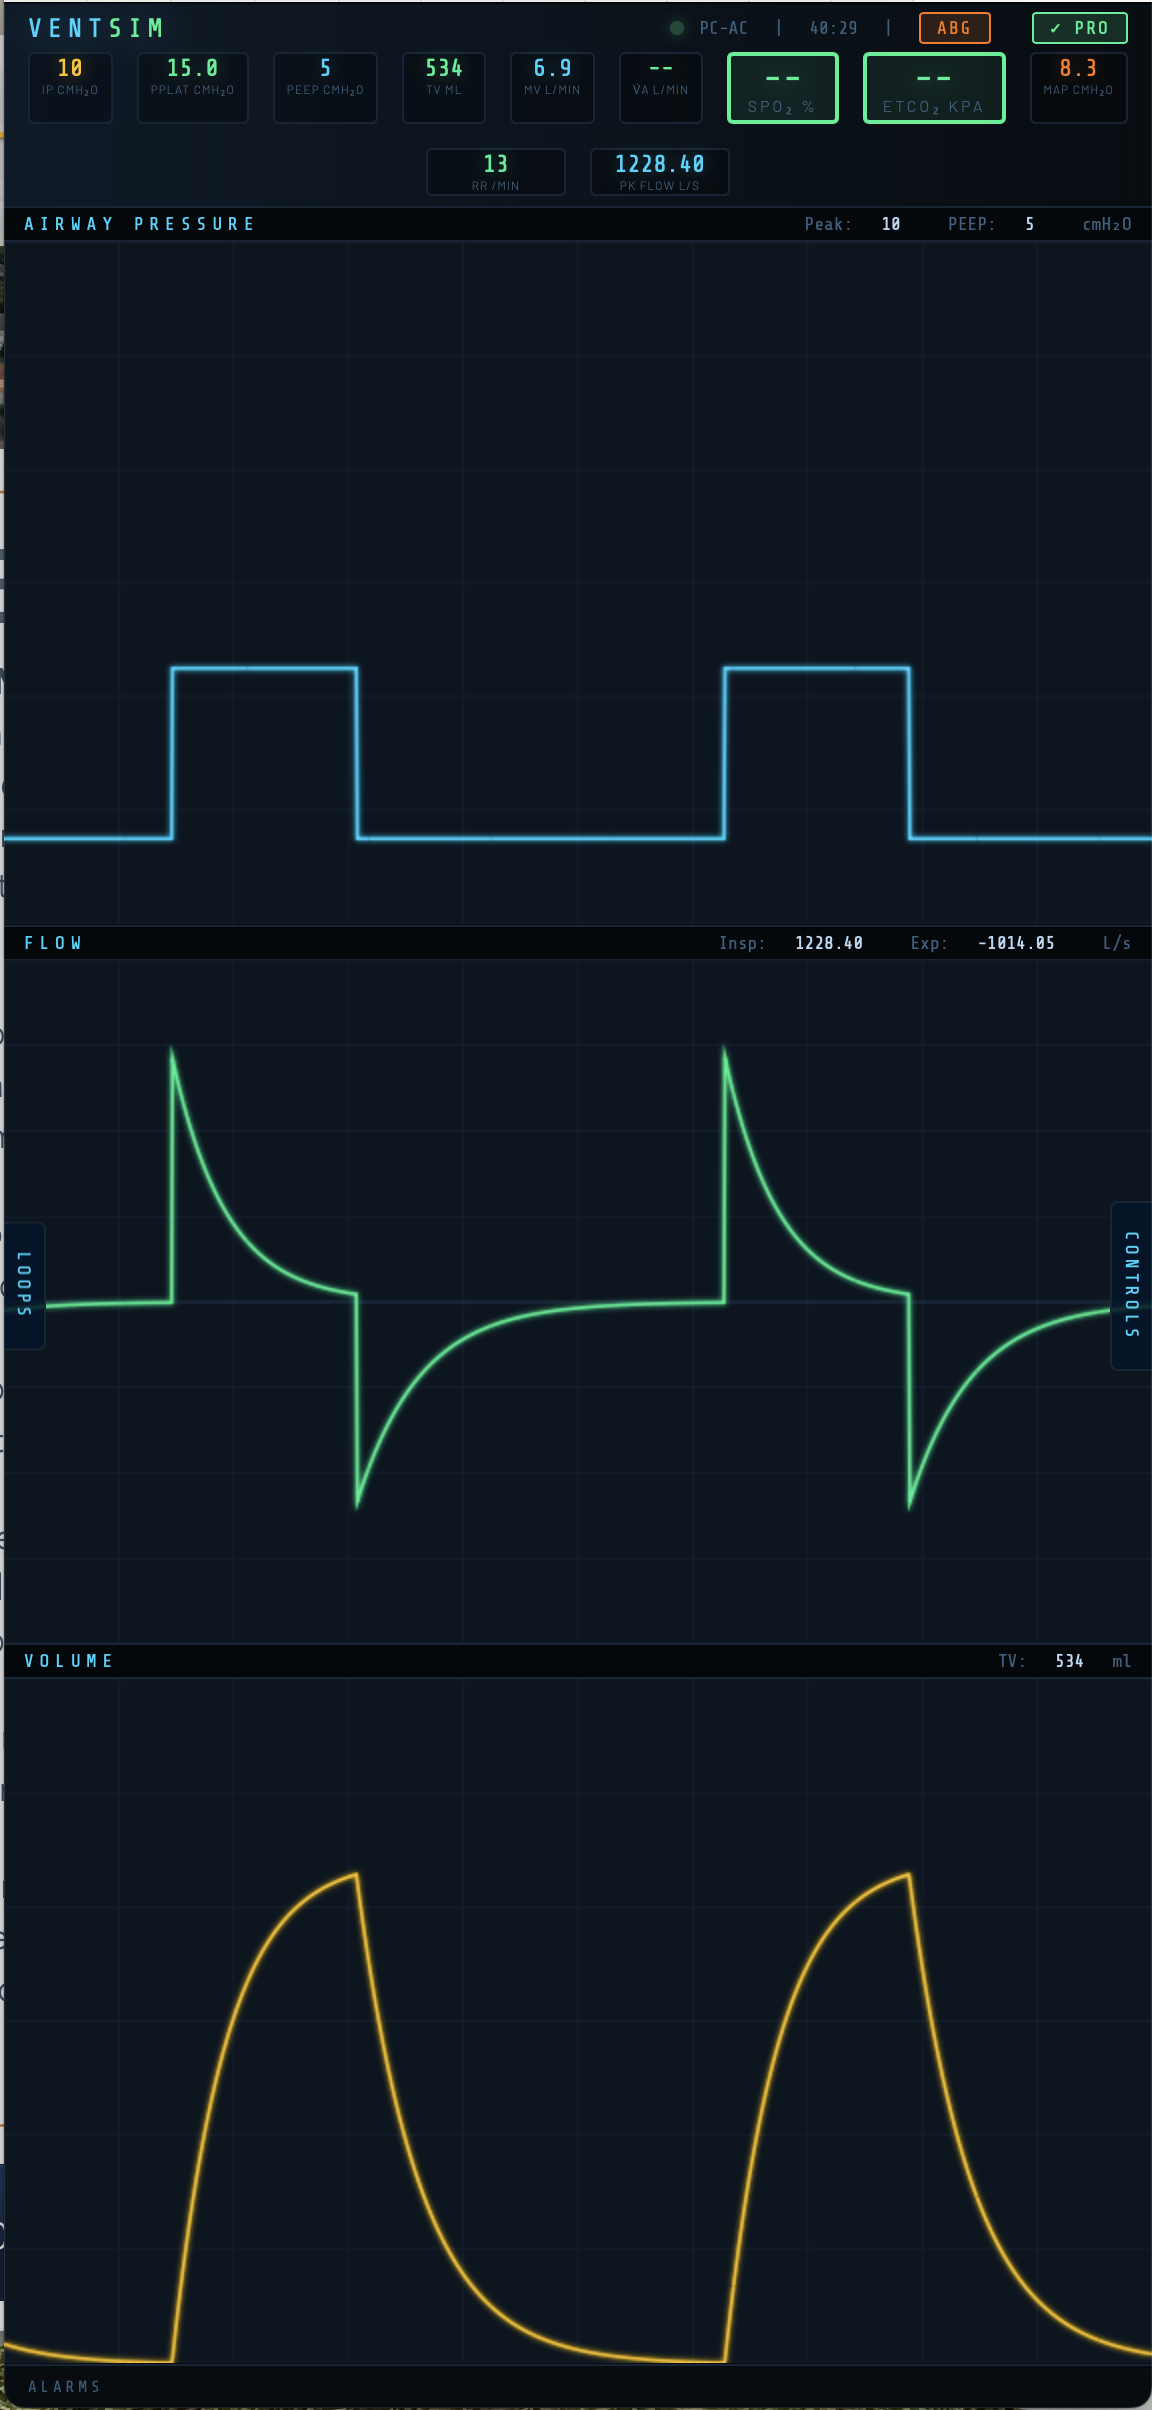
Waveform panel — the central area shows three continuously scrolling real-time traces: airway pressure (P-time), flow (F-time), and volume (V-time), updating with every simulated breath.
Control panels — accessed via the LOOPS and CONTROLS tabs on either side of the screen. On wider screens these appear as fixed columns. On mobile they slide in as overlays.

Setting Up the Patient Model
The patient model defines the respiratory mechanics and (in Pro) gas exchange physiology. Access it via the CONTROLS panel → Patient tab.
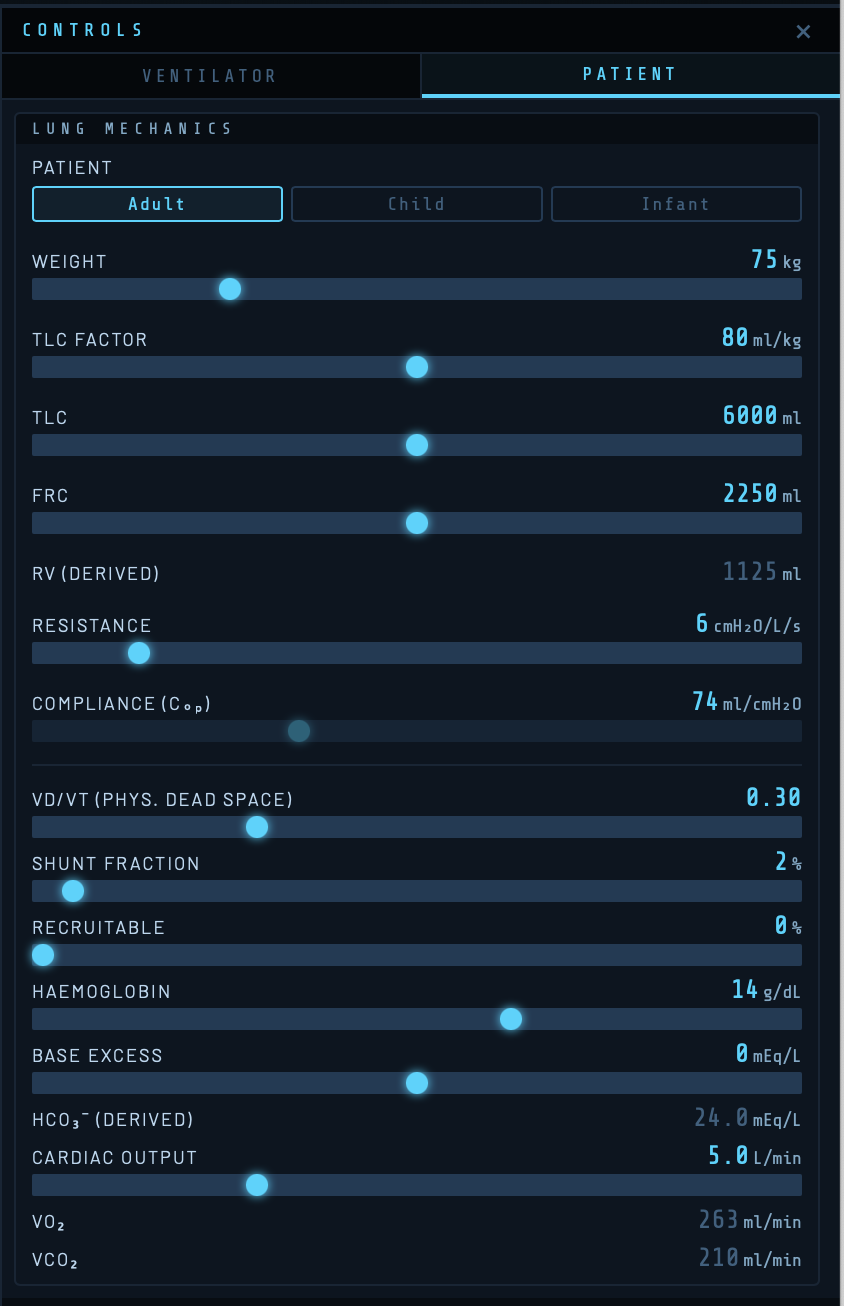
Patient Category
Three categories are available: Adult, Child, and Infant. Selecting a category scales all default values appropriately — weight range, lung volumes, airway resistance, cardiac output, and metabolic rate all adjust automatically.
| Category | Weight range | Default VO₂/kg | Default Hb |
|---|---|---|---|
| Adult | 50–150 kg | 3.5 ml/kg/min | 14 g/dL |
| Child | 10–50 kg | 5.0 ml/kg/min | 13 g/dL |
| Infant | 0.5–10 kg | 7.0 ml/kg/min | 16 g/dL |
Weight
Sets the patient’s body weight in kg. Weight drives the TLC calculation via the TLC Factor and scales anatomical dead space (2 ml/kg) and metabolic parameters.
TLC Factor and Total Lung Capacity
The TLC Factor (ml/kg) multiplied by weight gives the Total Lung Capacity (TLC). The default is 80 ml/kg, giving a TLC of 6,000 ml for a 75 kg adult. TLC sets the upper asymptote of the compliance curve. Adjusting either the TLC Factor or TLC slider updates the other automatically.
FRC — Functional Residual Capacity
FRC is the volume of gas remaining in the lungs at end-expiration with no applied pressure. It represents where the patient’s lungs sit on the compliance curve at zero airway pressure. The default is 37.5% of TLC (2,250 ml for a 75 kg adult).

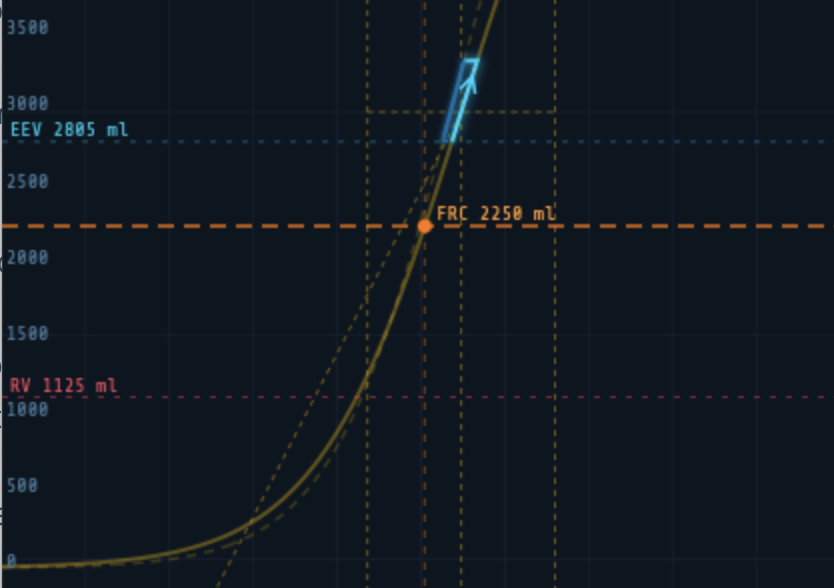
Moving the FRC slider shifts the orange marker along the compliance curve without changing the curve’s shape — the inflection point and steepness remain constant. Clinically this represents changing the patient’s resting lung volume: reduced FRC in obesity, ARDS, or pregnancy; increased FRC in emphysema.
Note: Residual Volume (RV) is displayed as a derived value of 50% of FRC and is not independently adjustable.
Airway Resistance
Sets total airway resistance in cmH₂O/L/s. Increased resistance produces the characteristic sawtooth flow waveform of obstructive lung disease and reduces peak flow for a given driving pressure.
| Clinical condition | Typical resistance |
|---|---|
| Normal adult (intubated) | 5–8 cmH₂O/L/s |
| Mild obstruction | 10–15 cmH₂O/L/s |
| Severe asthma / COPD | 20–40 cmH₂O/L/s |
Compliance
In linear mode, this slider directly sets static respiratory system compliance in ml/cmH₂O. A normal adult value is 60–100 ml/cmH₂O. In sigmoidal mode this control is disabled and instead displays the effective compliance at the current operating point (Cop) — the compliance the ventilator actually experiences at the current PEEP position on the sigmoid.
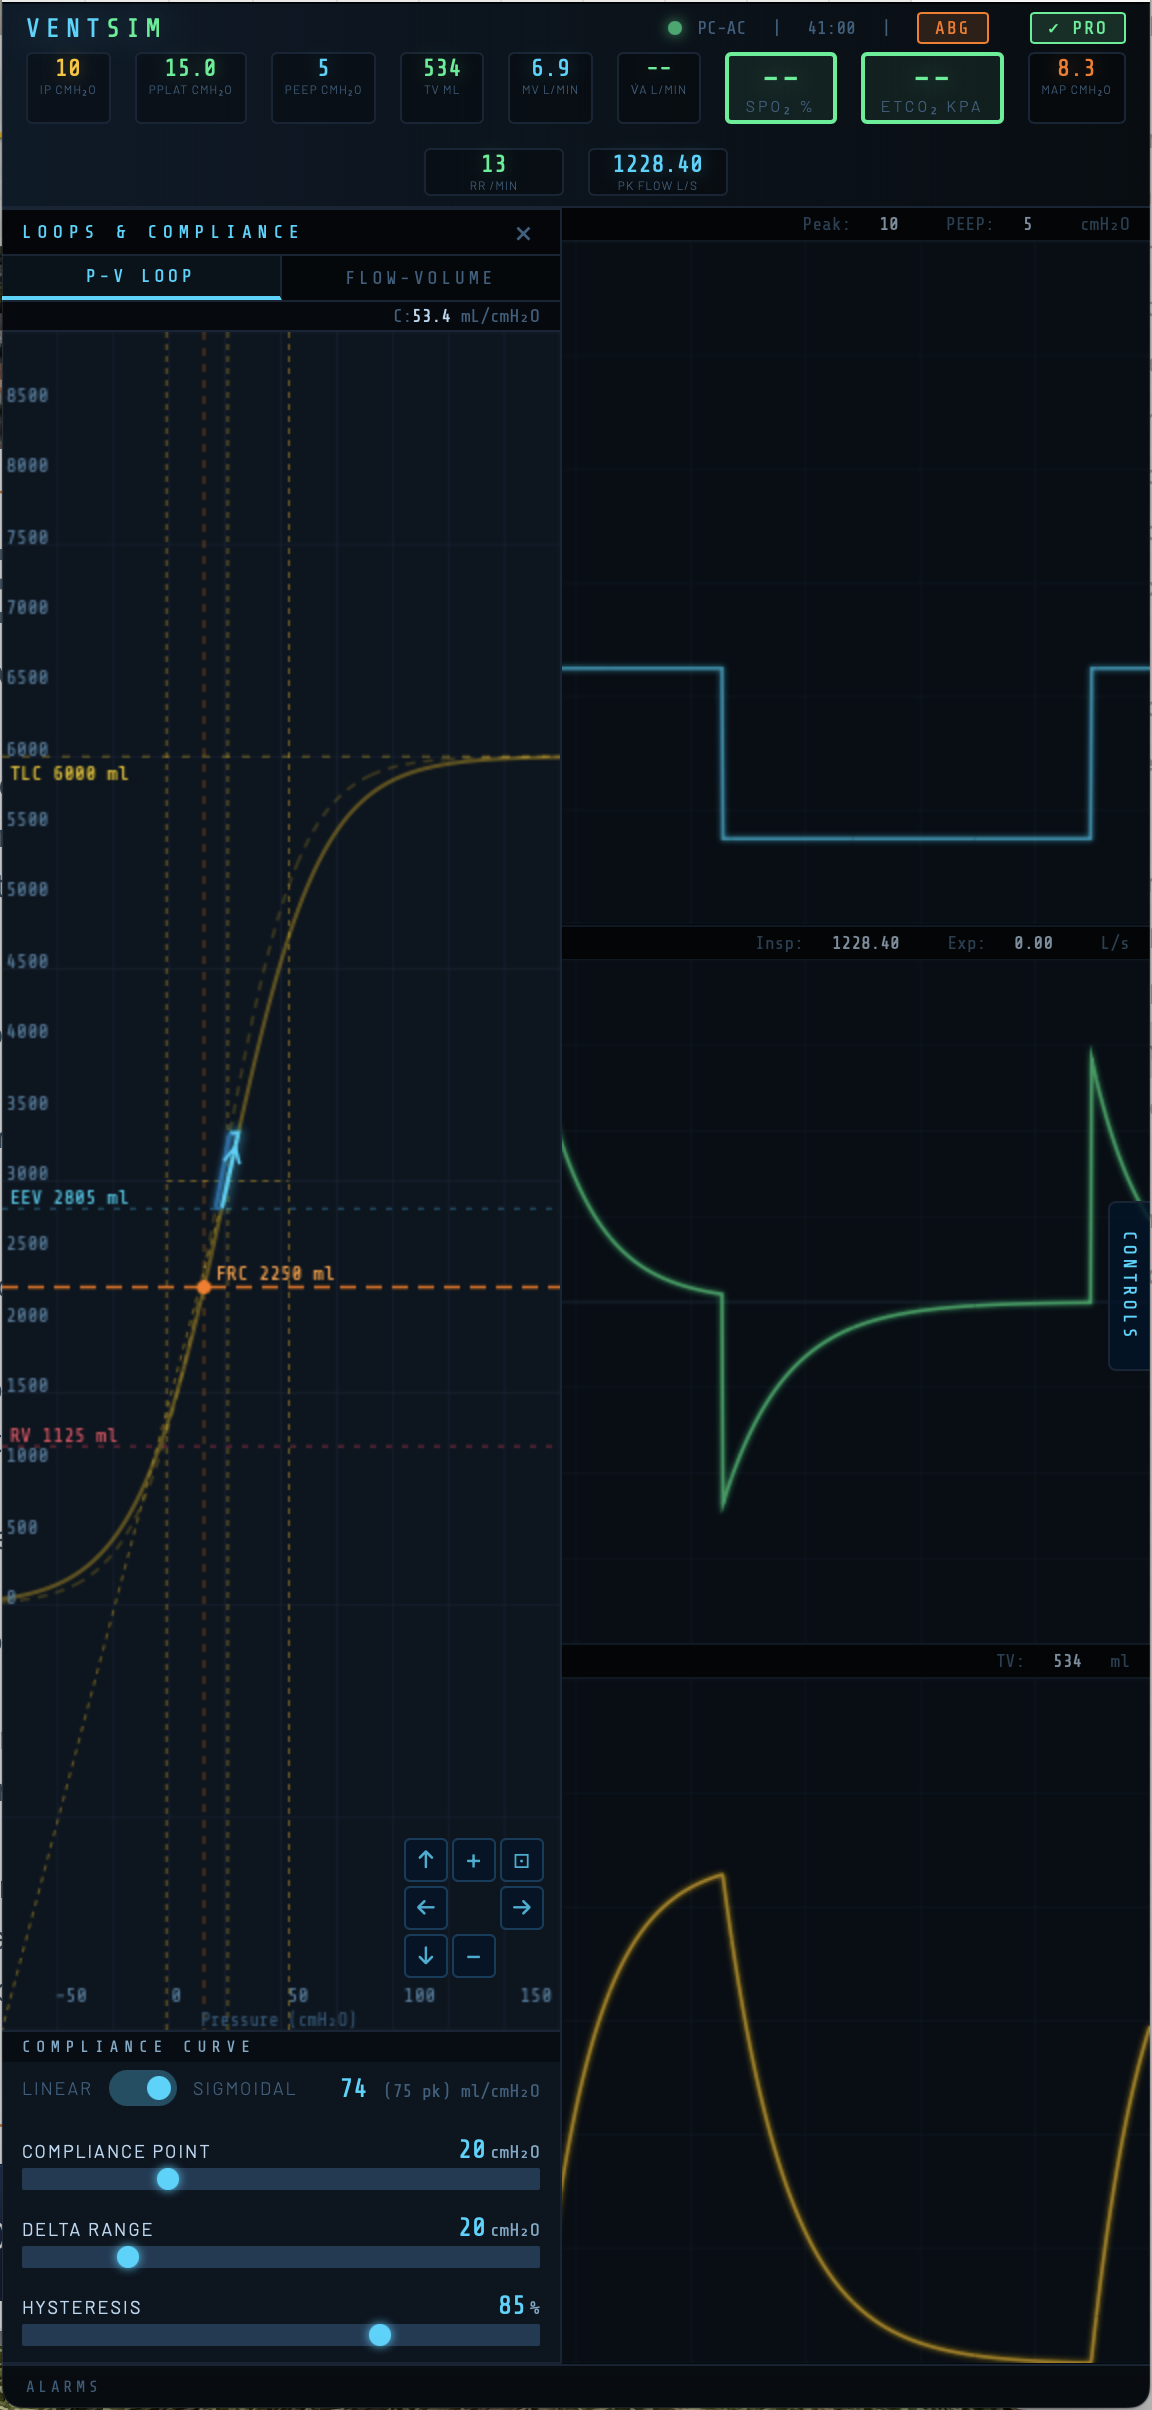
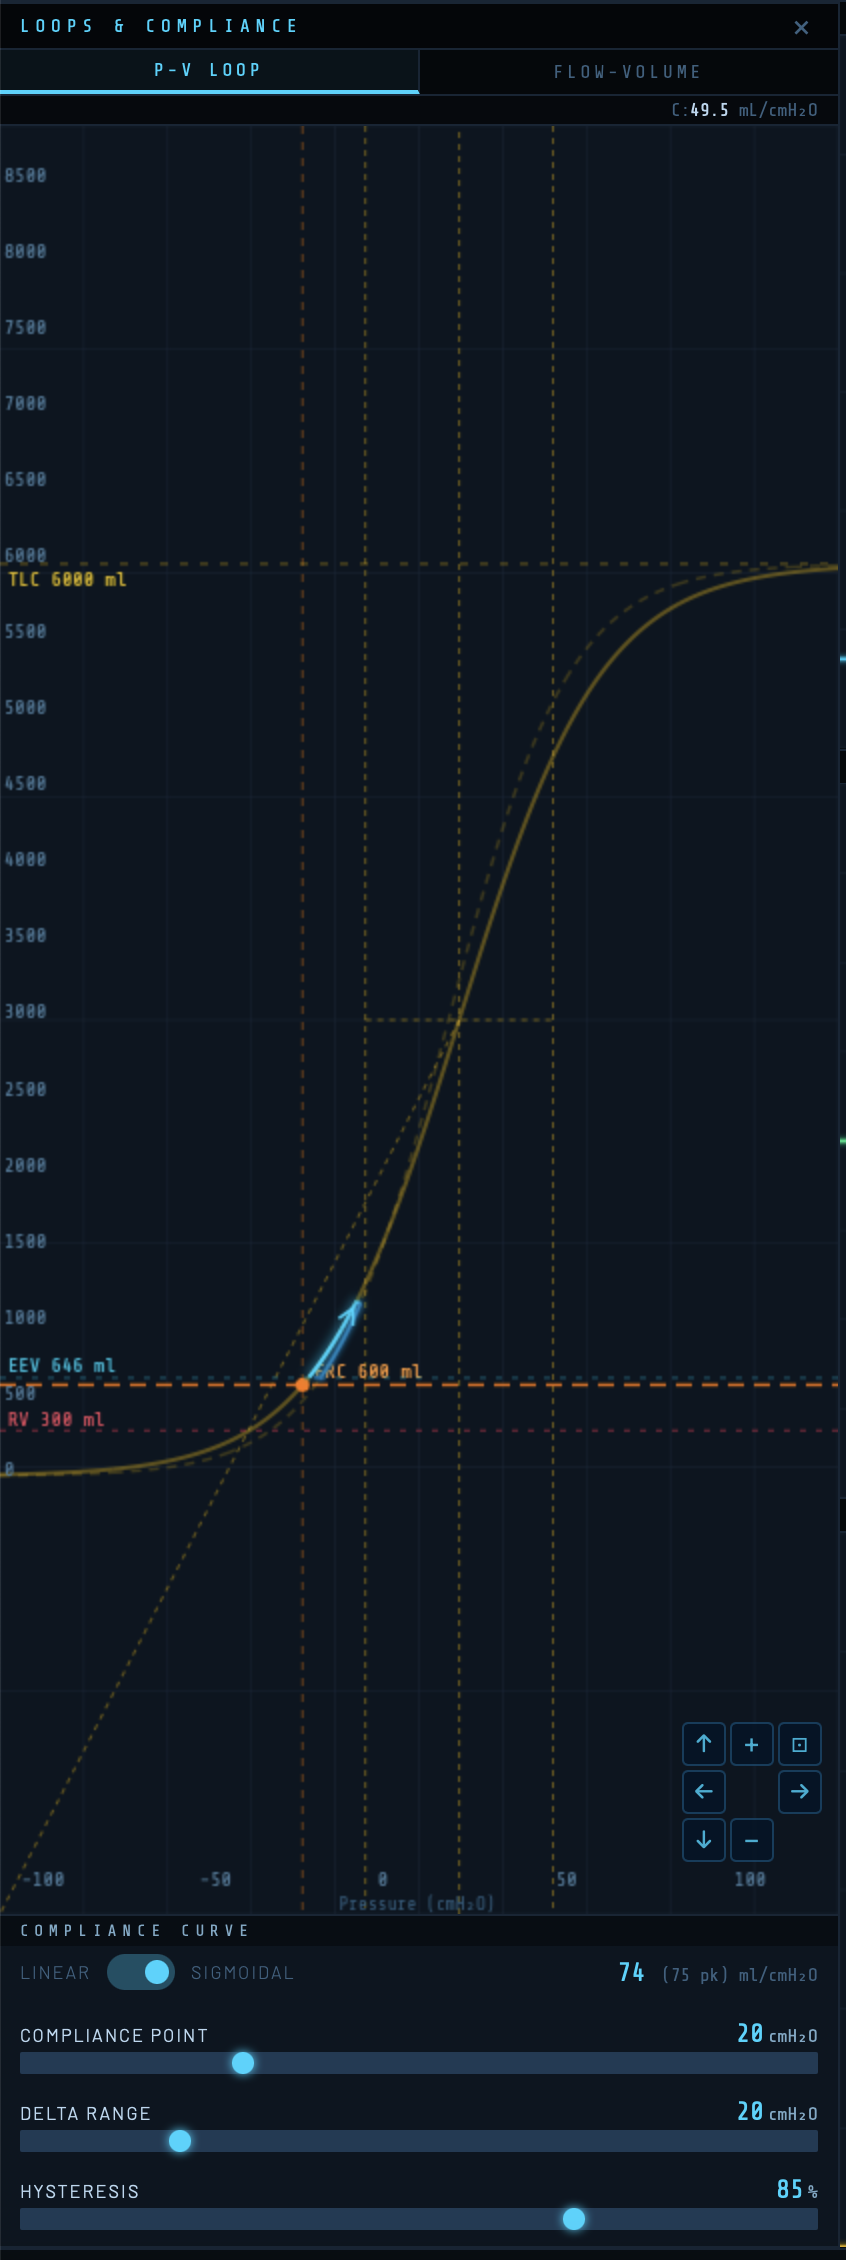
The Compliance Curve
Access the compliance curve via the LOOPS panel. A toggle switches between Linear and Sigmoidal compliance models.
Linear Compliance
In linear mode the pressure-volume relationship is a straight line: tidal volume = compliance × driving pressure throughout the breath. This is appropriate for basic teaching of ventilator mechanics.
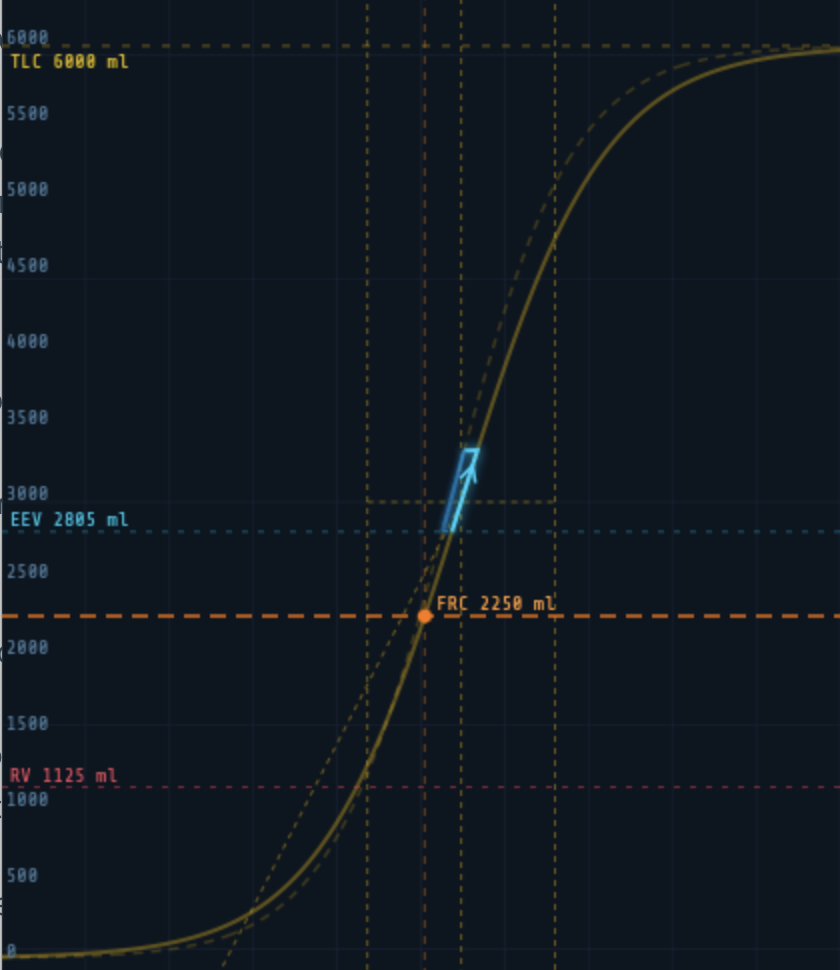
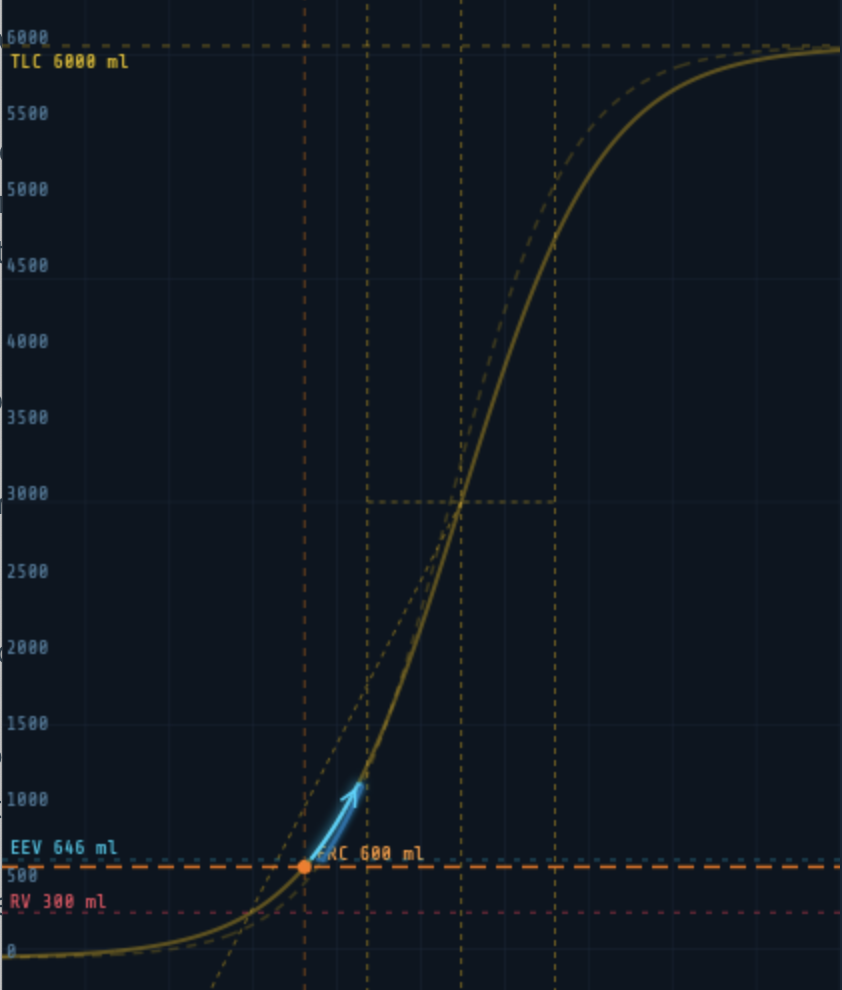
Sigmoidal Compliance
The sigmoidal model reflects the true S-shaped pressure-volume curve of the respiratory system. Compliance is lowest at very low and very high lung volumes, and greatest near the inflection point. This allows simulation of recruitment, overdistension, and the effects of PEEP position on effective compliance.
Three controls set the shape and position of the sigmoid:
Compliance Point (cmH₂O)
Sets the absolute pressure at the inflection point of the sigmoid — the pressure at which compliance is greatest. Moving this slider shifts the entire curve left or right along the pressure axis. Two vertical crossbar lines on the canvas mark the inflection and the ±1.317 × Delta Range boundaries (the pressures at which the curve reaches 25% and 75% of TLC).
Delta Range (cmH₂O)
Controls the steepness of the sigmoid. A smaller Delta Range produces a steep, narrow curve with high peak compliance but a small safe tidal volume range. A larger value flattens the curve, reducing peak compliance but widening the range of safe operating pressures. The crossbar lines widen or narrow visibly as this is adjusted.
Hysteresis (%)
Sets the energy recovery fraction between inspiratory and expiratory limbs. At 100% there is no hysteresis. At 85% (the default) the expiratory limb sits to the left of the inspiratory limb, as seen in real lung tissue. The expiratory curve is shown as a dashed line.
The PV loop drawn during breathing is overlaid on the compliance curve in real time, showing directly where in the pressure-volume relationship each breath is occurring. The inspiratory limb is shown in cyan, the expiratory limb in blue.
Gas Exchange Parameters
★ Pro feature: All parameters in this section require a VentSim Pro licence.
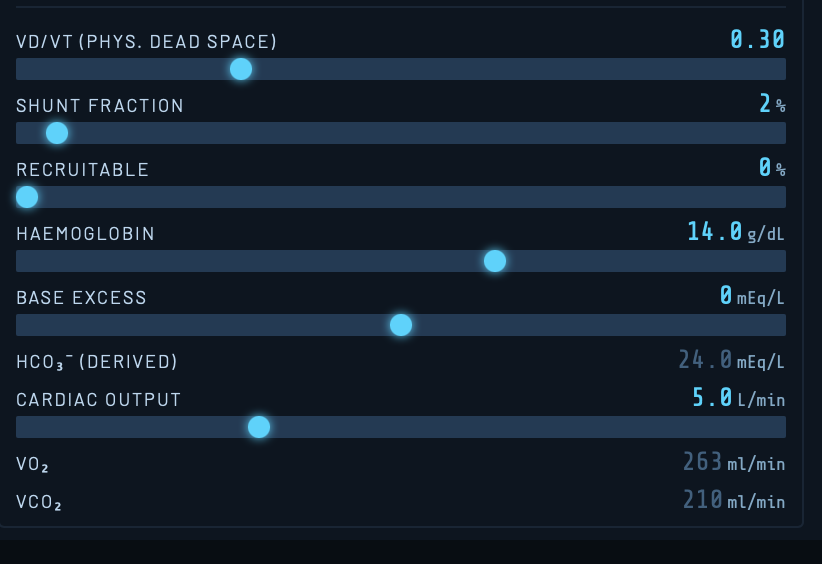
VD/VT — Physiological Dead Space Fraction
The ratio of physiological dead space to tidal volume (default 0.30). This includes anatomical dead space (fixed at 2 ml/kg) plus alveolar dead space from V/Q mismatch. Increasing VD/VT reduces alveolar ventilation, raising PaCO₂ and lowering ETCO₂. In ARDS and pulmonary embolism VD/VT can exceed 0.60.
Shunt Fraction
The percentage of cardiac output passing through non-ventilated lung units (true shunt, V/Q = 0). Default is 2%. Shunt causes hypoxaemia that is refractory to supplemental oxygen because shunted blood bypasses ventilated alveoli entirely. Increasing FiO₂ has diminishing returns as shunt fraction rises.
Recruitable
The percentage of lung that is collapsed but potentially recruitable with increased airway pressure. As this value increases, higher PEEP or mean airway pressure will progressively recruit these units, reducing effective shunt and improving oxygenation. This interacts with PEEP position on the PV loop — PEEP above the lower inflection point produces greater recruitment.
Haemoglobin
Haemoglobin concentration in g/dL. Affects oxygen carrying capacity and hence arterial oxygen content. Default values: Adult 14 g/dL, Child 13 g/dL, Infant 16 g/dL.
Base Excess
Metabolic component of acid-base status in mEq/L. Positive values indicate metabolic alkalosis; negative values metabolic acidosis. This shifts pH and bicarbonate in the ABG readout. Derived HCO₃⁻ is calculated using the Henderson-Hasselbalch relationship.
Cardiac Output
Cardiac output in L/min. Drives the rate of oxygen delivery and CO₂ removal. Reduced cardiac output increases oxygen extraction, lowering mixed venous PO₂ and worsening hypoxaemia for any given shunt fraction — the physiological basis of the haemodynamic-gas exchange interaction in critical illness.
Setting the Ventilator
Access ventilator controls via the CONTROLS panel → Ventilator tab.
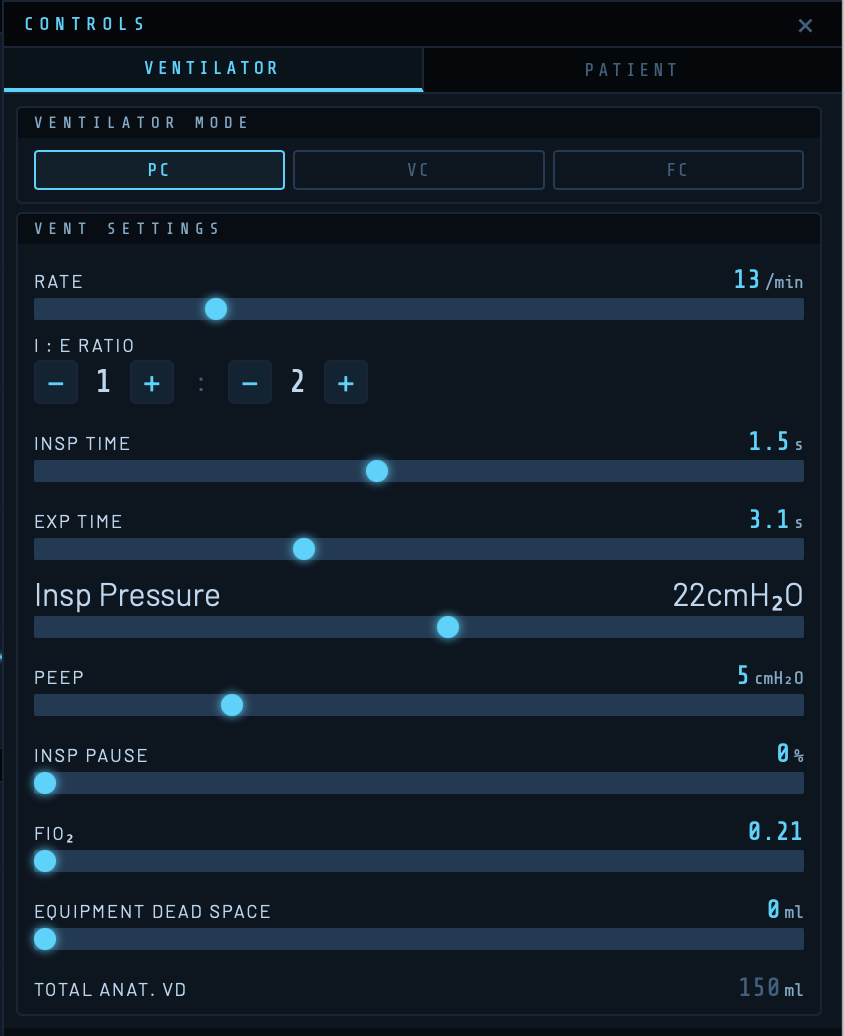
Ventilation Mode
| Mode | Description | Waveform characteristics |
|---|---|---|
| PC-AC | Pressure Control, Assist-Control. Fixed inspiratory pressure above PEEP delivered for the set Ti at the set rate. Tidal volume determined by compliance and resistance. | Square pressure trace, decelerating flow |
| VC-AC | Volume Control, Assist-Control. Fixed tidal volume at set flow rate. Airway pressure varies with compliance and resistance. | Square flow trace, rising pressure |
| Flow | Constant flow throughout inspiration. Primarily for teaching flow-pressure relationships. | Constant flow, linear pressure rise |
Rate
Respiratory rate in breaths per minute (range 4–40/min). Combined with I:E ratio this sets Ti and Te.
I:E Ratio, Inspiratory Time, and Expiratory Time
These three parameters are linked. The I:E ratio buttons (1:1 through 1:4) set standard ratios; Ti and Te can also be adjusted directly. The default is a rate of 13/min with Ti 1.5 s and Te 3.0 s (I:E 1:2).
[ SCREENSHOT: I:E ratio buttons and Ti/Te displays ]
Inspiratory Pressure (PC-AC)
Pressure delivered above PEEP during inspiration in cmH₂O. Total peak airway pressure = PEEP + inspiratory pressure. Default: 10 cmH₂O above a PEEP of 5, giving a peak pressure of 15 cmH₂O.
Tidal Volume (VC-AC)
Target tidal volume in ml for volume-controlled ventilation. Default 500 ml.
Inspiratory Flow (VC-AC)
Constant inspiratory flow rate in L/min for volume-controlled ventilation. Default 60 L/min.
PEEP — Positive End-Expiratory Pressure
Applied positive pressure at end-expiration in cmH₂O. PEEP shifts the operating point on the compliance curve — the end-expiratory volume (EEV) marker on the PV loop moves upward along the expiratory limb as PEEP increases. PEEP also interacts with the recruitable shunt fraction in the gas exchange model.
Inspiratory Pause
A percentage of inspiratory time held at zero flow after the breath is delivered. Creates an end-inspiratory plateau, allowing visualisation of static compliance. Appears as a flat segment on the pressure waveform and a zero-flow period on the flow trace.
FiO₂
Fractional inspired oxygen (0.21–1.0). Drives alveolar PO₂ and arterial oxygenation in the gas exchange model (Pro). FiO₂ also appears as the denominator of the P/F ratio in the ABG modal.
Equipment Dead Space
Dead space added by ventilator circuit components (HME filters, catheter mounts, angle pieces) in ml. Additive to the patient’s anatomical dead space. Total anatomical dead space (patient + equipment) is displayed below as a derived value.
Monitored Values

| Badge | Description |
|---|---|
| IP | Peak inspiratory pressure (cmH₂O) |
| Pplat | Plateau pressure at end-inspiration (cmH₂O) |
| PEEP | Applied PEEP (cmH₂O) |
| TV | Delivered tidal volume (ml) |
| MV | Minute volume (L/min) |
| V̇A | Alveolar minute ventilation (L/min) — Pro |
| SpO₂ | Arterial oxygen saturation (%) — Pro |
| ETCO₂ | End-tidal CO₂ (kPa) — Pro |
| MAP | Mean airway pressure (cmH₂O) |
| RR | Respiratory rate (/min) |
| Pk Flow | Peak inspiratory flow (L/s) |
SpO₂ Alarm States
★ Pro feature: SpO₂ monitoring requires VentSim Pro.
| Colour | SpO₂ range | Meaning |
|---|---|---|
| Green | ≥94% | Normal |
| Amber | 88–94% | Warning |
| Red | 72–88% | Alarm |
| Red (flashing) | <72% | Critical |
ETCO₂ Alarm States
★ Pro feature: ETCO₂ monitoring requires VentSim Pro.
| Colour | ETCO₂ range | Meaning |
|---|---|---|
| Green | 4.0–6.0 kPa | Normal |
| Amber | 2.5–4.0 or 6.0–8.0 kPa | Warning (hypo/hyperventilation) |
| Red (flashing) | <2.5 or >8.0 kPa | Critical |
Arterial Blood Gas Sampling
★ Pro feature: ABG sampling requires VentSim Pro.
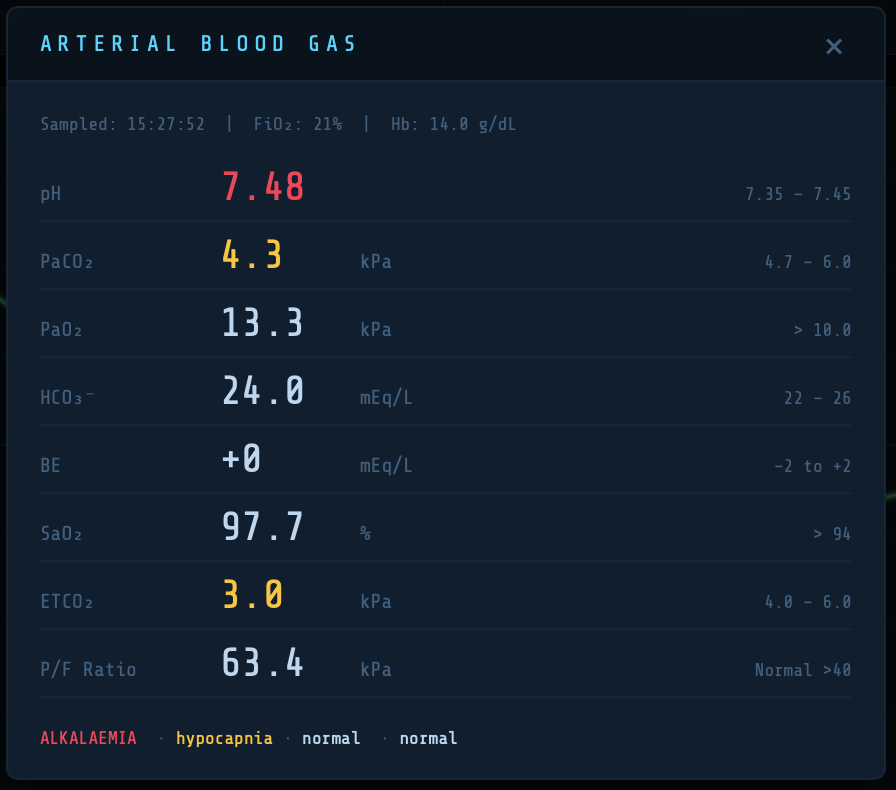
Tap the ABG button in the header to take a snapshot arterial blood gas. Values outside the reference range are colour-coded amber or red.
| Parameter | Reference range | Clinical note |
|---|---|---|
| pH | 7.35–7.45 | |
| PaCO₂ | 4.5–6.0 kPa | Primary driver of ventilatory demand |
| PaO₂ | 10–13.3 kPa | On air; higher expected on supplemental O₂ |
| HCO₃⁻ | 22–26 mEq/L | Derived from base excess |
| Base excess | −2 to +2 mEq/L | Set directly in patient panel (Pro) |
| SaO₂ | >94% | From Severinghaus ODC |
| ETCO₂ | 4.0–6.0 kPa | PaCO₂ × (1 − VD/VT) |
| P/F ratio | >40 kPa normal | Berlin ARDS criteria applied |
The P/F ratio label dynamically reflects ARDS severity: mild (<40 kPa), moderate (<26.7 kPa), severe (<13.3 kPa).
Note: ETCO₂ is always lower than PaCO₂ by the dead space fraction. As dead space increases — in ARDS, pulmonary embolism, or low cardiac output — the PaCO₂-to-ETCO₂ gradient widens.
ETCO₂ Monitoring and Capnography
★ Pro feature: VentSim includes a physiologically modelled capnograph that generates a real-time CO₂ waveform at the airway. The model simulates the gas column mechanics of the respiratory circuit, dead space gas dynamics, alveolar mixing, and the effects of lung unit time-constant heterogeneity on the shape of the capnogram. This section describes the model, its controls, and the physiological principles underlying its behaviour.
The Gas Column Model
The capnograph is modelled as a column of gas extending from the alveolar surface to the sensor sampling point. The column is divided into thin slices (3 ml each), and advances in the direction of gas flow on each simulation step. The sensor is positioned at the proximal end of the equipment dead space, equivalent to a sidestream capnograph sampling at the Y-piece of the breathing circuit.
This positioning means that the sensor sees two distinct dead space regions:
- Anatomical dead space — the conducting airways of the patient (approximately 2 ml/kg body weight). This gas must be flushed past the sensor before alveolar gas is seen during expiration (Phase I).
- Equipment dead space — the volume of the breathing circuit between the Y-piece and the patient airway (default 30 ml). During the first part of each inspiration, this volume — which contains alveolar gas from the previous expiration — is re-inhaled past the sensor, producing a brief plateau of end-tidal CO₂ at the very start of the inspiratory downstroke.
The total dead space (anatomical + equipment) determines the width of Phase I on expiration and the duration of the rebreathing notch at the start of inspiration.
Capnogram Phases
The waveform is colour-coded by phase:
| Colour | Phase | Description |
| Dim blue | Phase 0 / Phase I | Inspiration and expiratory dead space flush — CO₂ near zero |
| Amber | Phase II | Sigmoid upswing — dead space / alveolar mixing front |
| Green | Phase III | Alveolar plateau — true end-tidal gas |
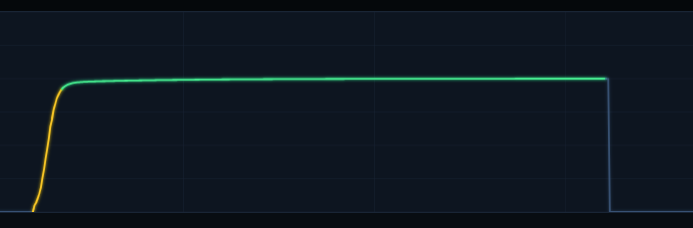
Phase 0 — Inspiration
Fresh gas enters from the ventilator circuit. The sensor first sees the equipment dead space gas (alveolar CO₂ from the previous breath) being re-inhaled — this appears as a brief notch at ETCO₂ level at the very start of inspiration. Once fresh gas reaches the sensor (after approximately the equipment dead space volume has been inspired), the trace drops sharply to zero.
Phase I — Expiratory Dead Space
Expiration begins. The gas emerging past the sensor is dead space gas — it has not participated in alveolar gas exchange and contains negligible CO₂. Phase I lasts until the anatomical dead space has been flushed (approximately VD_anat ml of expiratory flow).
Phase II — Alveolar-Dead Space Mixing Front
The boundary between dead space gas and alveolar gas arrives at the sensor. A sigmoid mixing front represents axial diffusion and convective mixing at this interface. The width of Phase II is scaled adaptively to the available alveolar tidal volume, so that even in high-resistance states with small tidal volumes, Phase II remains visible rather than collapsing to a step change.
Phase III — Alveolar Plateau
Pure alveolar gas passes the sensor. In a healthy, homogeneous lung all alveolar units empty simultaneously, giving a flat plateau whose peak value equals the mean alveolar PCO₂. In disease, units with long time constants (high resistance or high compliance) empty progressively later in expiration, causing a rising slope across Phase III — the characteristic alpha angle of obstructive lung disease. The height of this slope is controlled by the Lung Unit TC Distribution slider.
Relevant Controls
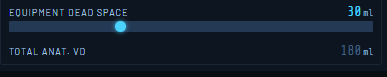
Equipment Dead Space (Ventilator tab)
Default 30 ml. Represents the internal volume of HME filters, connectors, elbow pieces and other circuit components between the Y-piece and the patient airway. Increasing this value widens the inspiratory CO₂ notch and slightly reduces effective alveolar ventilation. This effect is clinically important in small patients (neonates and infants) where equipment dead space may represent a substantial fraction of tidal volume.
Anatomical Dead Space (Ventilator tab — Total VD display)
Calculated automatically as 2 ml/kg body weight. Displayed alongside equipment dead space to show total dead space. Changes with patient weight and category.
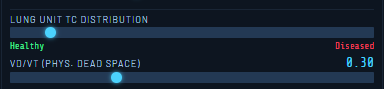
Lung Unit TC Distribution (Patient tab — Pro)
Range: Healthy (left) to Diseased (right). Controls the standard deviation of the alveolar time-constant distribution. In health, all lung units have similar time constants (narrow distribution) and empty nearly simultaneously, giving a flat Phase III plateau. As the slider moves toward Diseased, the distribution widens, causing slow units to empty progressively later in expiration and producing the characteristic rising Phase III slope of obstructive lung disease. This simultaneously affects the arterial blood gas — the V/Q heterogeneity associated with TC mismatch raises PaCO₂ above ETCO₂.
VD/VT — Physiological Dead Space (Patient tab — Pro)
The physiological dead space fraction represents alveoli that are ventilated but not perfused (high V/Q units — alveolar dead space). Increasing VD/VT reduces effective alveolar ventilation, causing PACO₂ and PaCO₂ to rise. It does not directly affect the capnograph waveform shape, but raises the overall CO₂ level and widens the alveolar-arterial gradient.
Gas Partial Pressure Relationships
Understanding the relationship between the three CO₂ values displayed by VentSim is central to interpreting ventilatory adequacy:
- PACO₂ (mean alveolar) — the ventilation-weighted mean CO₂ of the gas-exchanging alveolar pool. Represents the steady-state CO₂ that drives diffusion into blood across all perfused alveoli.
- ETCO₂ (end-tidal) — the CO₂ at the very end of expiration, sampled from the last gas to leave the lung. In health this equals the mean PACO₂. In disease it rises above it, because slow units empty late and contribute higher-than-average CO₂ to the expiratory stream.
- PaCO₂ (arterial) — the perfusion-weighted mean of alveolar PCO₂ across all gas-exchanging units, further elevated by the shunt fraction adding desaturated venous blood. Always the highest of the three values.
The correct ordering in all states is:
| Fundamental CO₂ gradient PaCO₂ > ETCO₂ > PACO₂ (mean) > FECO₂ (mean expired) In health the differences are small (< 0.5 kPa). In obstructive disease with V/Q heterogeneity, the PaCO₂–ETCO₂ gradient widens significantly, and ETCO₂ substantially underestimates PaCO₂ — a clinically critical point when using capnography to guide ventilation in COPD. |
Expected values at different disease severities (PACO₂ mean held at 5.3 kPa):
| State | PACO₂ (mean) | ETCO₂ (peak) | PaCO₂ (arterial) |
| Health (lutc = 0) | 5.3 kPa | ≈ 5.3 kPa (flat plateau) | 5.35 kPa |
| Moderate COPD (lutc = 0.5) | 5.3 kPa | 6.2 kPa (sloped plateau) | 6.5 kPa |
| Severe COPD (lutc = 0.8) | 5.3 kPa | 6.8 kPa (steep slope) | 7.2 kPa |
Clinical Teaching Points
- In health, ETCO₂ reliably approximates PaCO₂ and can guide ventilator adjustments without arterial blood gas sampling.
- In COPD or any cause of V/Q heterogeneity, ETCO₂ significantly underestimates PaCO₂. Ventilation guided by ETCO₂ alone may leave the patient hypercapnic.
- Increasing PEEP or reducing respiratory rate increases mean alveolar volume, which can recruit collapsed alveoli and improve V/Q matching — observe the improvement in SpO₂ and reduction in the PaCO₂–ETCO₂ gradient.
- Large equipment dead space reduces effective alveolar ventilation and raises PaCO₂, independent of lung disease. This is demonstrable in VentSim by increasing the Equipment Dead Space slider, particularly in small patient categories.
- The rising Phase III slope (alpha angle) is a specific marker of expiratory flow heterogeneity. It is prominent in COPD and severe asthma, and can be simulated by increasing airway resistance alongside the Lung Unit TC Distribution slider.
- At very high airway resistance, expiratory flow may be insufficient to fully flush the dead space within the expiratory time. In this state, alveolar gas never reaches the sensor and ETCO₂ falls — a sign of severe air trapping and inadequate expiratory time, not a reduction in alveolar CO₂.
Model Simplifications
VentSim uses a simplified representation of lung unit heterogeneity for computational efficiency. Rather than simulating individual alveolar units, the time-constant distribution is represented as a Gaussian-weighted contribution to the Phase III slope. The physiological consequences (V/Q mismatch, raised PaCO₂, upsloping capnogram) are modelled correctly at the system level, but the precise mechanism differs from first-principles multi-compartment models. In particular:
- The Phase III slope is modelled as slow units contributing progressively higher CO₂ during expiration. In reality, the slope also arises from sequential emptying and flow-weighted mixing, not solely from units being hypercapnic.
- The arterial CO₂ correction for V/Q heterogeneity uses a calibrated scaling factor rather than explicit perfusion-weighted integration across compartments.
- Cardiogenic oscillations (small CO₂ fluctuations due to cardiac motion) are not modelled.
These simplifications are appropriate for a teaching simulator and do not materially affect the clinical scenarios that VentSim is designed to demonstrate.
The Flow-Volume Loop
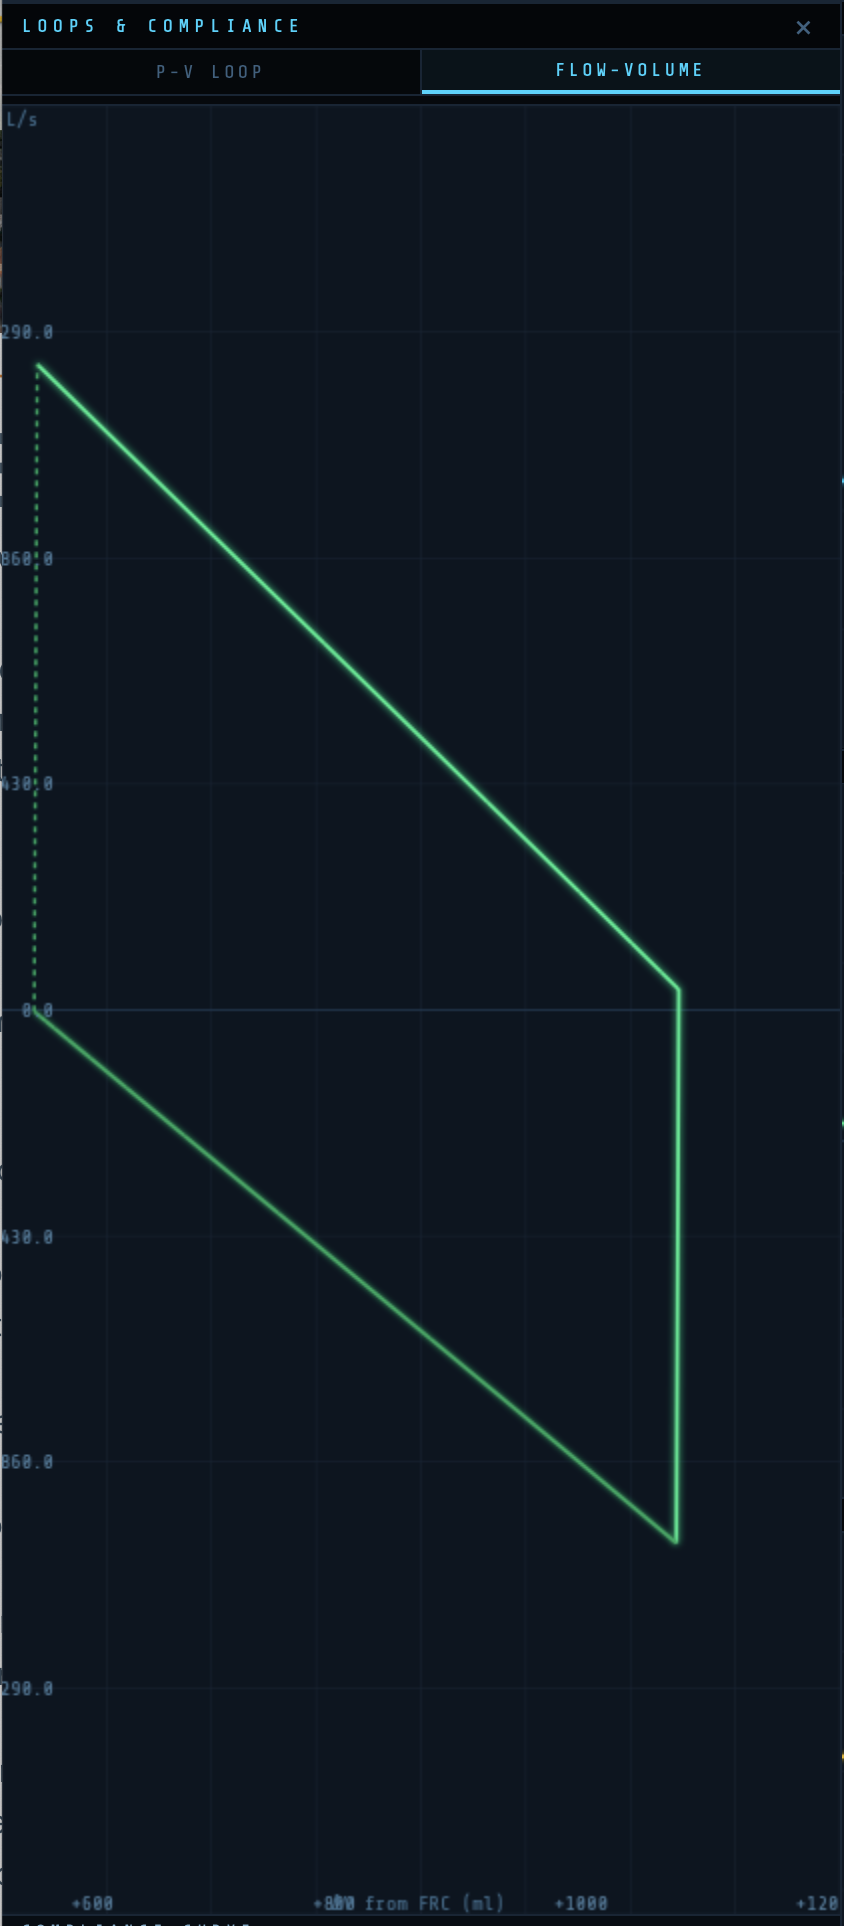
The Flow-Volume (FV) loop plots flow (y-axis, L/s) against change in volume from FRC (x-axis, ml). Inspiration is shown above the zero-flow line; expiration below.
In normal ventilation the loop is smooth and elliptical. Increased airway resistance produces a characteristic scoop in the expiratory limb. The FV loop provides airway mechanics information that complements the PV loop.
Scenarios
★ Pro feature: Scenarios require VentSim Pro.
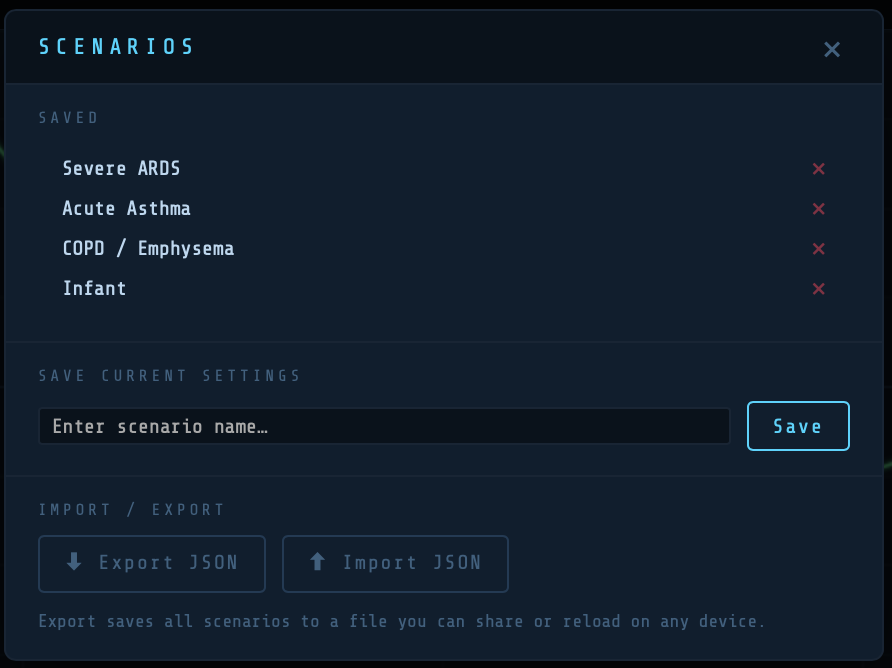
Scenarios allow you to save and reload complete ventilator and patient configurations. Access via the Scenarios button at the bottom of the Controls panel.
To save: enter a name and tap Save. To load: tap the scenario name. To delete: tap the × next to any scenario. Scenarios are stored locally in your browser.
Suggested scenarios to explore:
| Scenario | Key settings |
|---|---|
| Normal adult | Default settings — baseline for comparison |
| ARDS | Reduced compliance, high PEEP (12–14), high FiO₂ (0.6–0.8), high shunt, high VD/VT, recruitable lung |
| COPD exacerbation | High resistance (25–35 cmH₂O/L/s), low rate, long Te (I:E 1:3 or 1:4) |
| Obesity / reduced FRC | Low FRC, reduced compliance, moderate shunt |
| Pulmonary embolism | High VD/VT (0.5–0.7), normal mechanics, low cardiac output |
Reset and Pause
Pause — stops the simulation. Waveforms freeze. Useful when adjusting settings to observe the effect of a single change.
Reset — returns all settings to defaults (normal adult, PC-AC). Clears waveform buffers and PV loop history.
Getting VentSim Pro
VentSim Pro unlocks gas exchange modelling, ABG sampling, SpO₂ and ETCO₂ monitoring with alarm states, alveolar ventilation display, and clinical scenarios.
To upgrade:
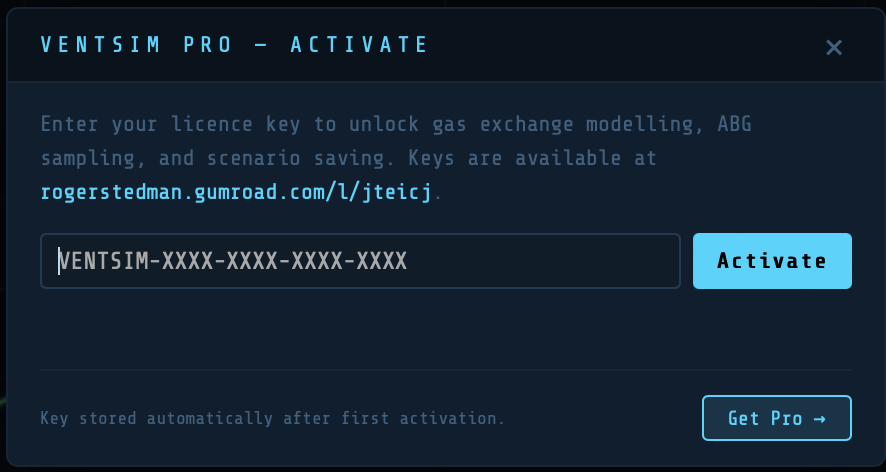
- Tap the ‘Get Pro’ button
- Follow the Gumroad purchase workflow
- Your key will be displayed and also emailed to you
- Return to the activation modal, enter your key, and tap ‘Activate’
- Your licence is stored in the browser automatically — you will not need to re-enter it
- But keep you key safe – you may need to re-enter it if VentSim is upgraded
The PRO button changes to ✓ PRO once activated.
Using VentSim in full Screen on a Smart Phone
When running VentSim in a browser window click the ‘Share’ button and select ‘Save link on Home Screen’. This will place the VentSim Icon on your home screen and launch it, like any other app, into its own full screen view with none of the browser screen clutter.
Physiological Model — Technical Notes
Compliance Model
Linear: V = C × P, where C is compliance (ml/cmH₂O) and P is airway pressure relative to FRC.
Sigmoidal: V(L) = Vmax / (1 + exp(−(P − Pinf) / Prange)), where P is absolute pressure, Pinf is the Compliance Point slider value, and Prange is the Delta Range. The expiratory limb applies a hysteresis factor h = hyst/100 to both parameters.
Gas Exchange Model
Alveolar gas composition is computed breath-by-breath using a stirred-tank model. Oxygen consumption (VO₂) and CO₂ production (VCO₂) are derived from weight, metabolic rate per kg, and cardiac output. Arterial blood gases are derived using the three-compartment shunt model:
CaO₂ = (1 − Qs) × Cc’O₂ + Qs × CvO₂
Where Qs is the effective shunt fraction, Cc’O₂ is end-capillary oxygen content (from alveolar PO₂), and CvO₂ is mixed venous oxygen content. SaO₂ is derived from PaO₂ using the Severinghaus oxyhaemoglobin dissociation curve. pH is calculated by the Henderson-Hasselbalch equation from PaCO₂ and HCO₃⁻.
ETCO₂ = PaCO₂ × (1 − VD/VT)
P/F ratio = PaO₂ (kPa) ÷ FiO₂
ARDS thresholds (Berlin definition, converted to kPa from mmHg by dividing by 7.5): mild <40 kPa (300 mmHg), moderate <26.7 kPa (200 mmHg), severe <13.3 kPa (100 mmHg).
VentSim is designed for educational purposes. It is not a medical device and should not be used for clinical decision-making.
© Roger Stedman — rogerstedman.com


A thought provoking piece that provides a more optimistic view of human intelligence compared to AI. Just as an athlete…
[…] https://rogerstedman.com/wp/blameworthy-acts-in-a-blame-free-safety-culture/ […]
[…] that most people would agree we need to promote, foster and support in healthcare. This piece; Blameworthy acts in…
Great blog. Your matrix, which shows psychological safety as being a pre-requisite for learning, aligns with Deming's (usually overlooked) principle…
Great post Roger. Spot on. Having now stopped clinical practise but still deal with clinicians on a daily basis, I…