
I have just finished reading the astonishing book by Daniel Kahneman ‘Thinking, Fast and Slow’ – it is a book that takes you on a journey of thirty years of discovery in psychological science. Once you read it you will never ‘think’ about yourself the same way again. The central tenet of the book is particularly salient to the conversation in the health service about mortality and the statistics relating to it following the recent publication of the findings of the second Francis report.
Judgements, Biases and Heuristics
Kahneman describes three dichotomous concepts – Firstly two types of thinking ‘System 1’ (Fast, intuitive, associative, innate and effortless) and ‘System 2’ (Slow, analytical, calculating, learning and effortful); Secondly two types of people ‘Econs’ (rational, consistent, logical, ideal economic agents that always make the ‘right’ choice) and ‘Humans’ (reasonable but subject to biases of their thinking such as priming, framing, narrative fallacy, imabalanced attitudes towards risk of loss and gain, excessive weighting to ‘available’ evidence, relatively blind to statistics and the ‘external’ view); Thirdly two ‘Selves’ the experiencing self (the person reading this blog here and now) and the remembered self (the person your mind has created through the narrative stitching of remembered events and experiences). For more details – go and read the book…
What is particularly interesting about his research is that he has demonstrated unequivocally time and again that being an ‘expert’ in any field, be it healthcare, economics or even psychology itself, does not protect you from these innate biases of human thinking – even when you know they exist they still influence you, and in fact being an expert simply puts you in a position where these biases are more consequential (your biases harm other people as well as yourself). He does, however, describe a number of strategies that organisations can adopt that defend against the consequences of individual judgment bias, strategies that need to be adopted systematically and deliberately. He gives examples of spectacular corporate failure, through group think, where these strategies had not been adopted.
The Statistics of Death
Why is this all relevant to us following the Mid-Staffs crisis, Francis report and the renewed scrutiny of hospitals with ‘outlying’ mortality figures? In the pantheon of spectacular corporate failure the events in 2007 at the Mid-Staffordshire NHS Foundation Trust must rank prettily highly, and of course the principle theme of the second Francis report is that this was an NHS corporate failure, not just a hospital failure. One of the central themes of the crisis centres on the role, meaning and response to mortality statistics for the hospital at the time. It is worth, therefore, taking a little time to understand how mortality statistics are generated.
At the time there was a single statistical measure routinely used to compare mortality in hospitals across the NHS – Hospital Standardised Mortality Ratio (HSMR). HSMR is calculated by taking the observed death rate and dividing it by a calculated figure for an ‘expected’ death rate. The expected death rate is essentially the death rate in hospitals for the whole of the UK with a number of adjustments made in order to compensate for differences in case mix (the diagnoses patients are admitted with), age, co-morbidity and social deprivation. The ratio is multiplied by 100, so if your observed death rate is the same as the expected then the ratio is 1.0 and the HSMR would be 100. When observing mortality in a population it is important to recognise that over time mortality will always increase (we all have to die eventually) – therefore when comparing mortality in different populations we have to know over what time period mortality has been counted (usually 30 days, 90 days, 1 year or 5 years). One of the weaknesses of HSMR is that it does not specify the time period – it is simply the time spent in hospital – therefore a hospital with a longer than average length of stay will tend to have a higher mortality. Another weakness of HSMR is that it does not have a diagnostic category code for palliative care. The provision of out of hospital end of life services across the UK is at best patchy, where provision is poor patients are admitted to hospital to die, HSMR does not adjust for these expected deaths and so hospitals in this situation will have a higher than ‘expected’ HSMR. As a result of these statistical biases, HSMR is being replaced by a newer indicator – Standardised Hospital Mortality Indicator (SHMI). SHMI is very similar to HSMR but differs in two important aspects. Firstly it expands the number of diagnostic codes against which case mix adjustment takes place from 56 to 140, including one for palliative care. Secondly it fixes the number of days over which mortality is measured to 30 days after discharge.
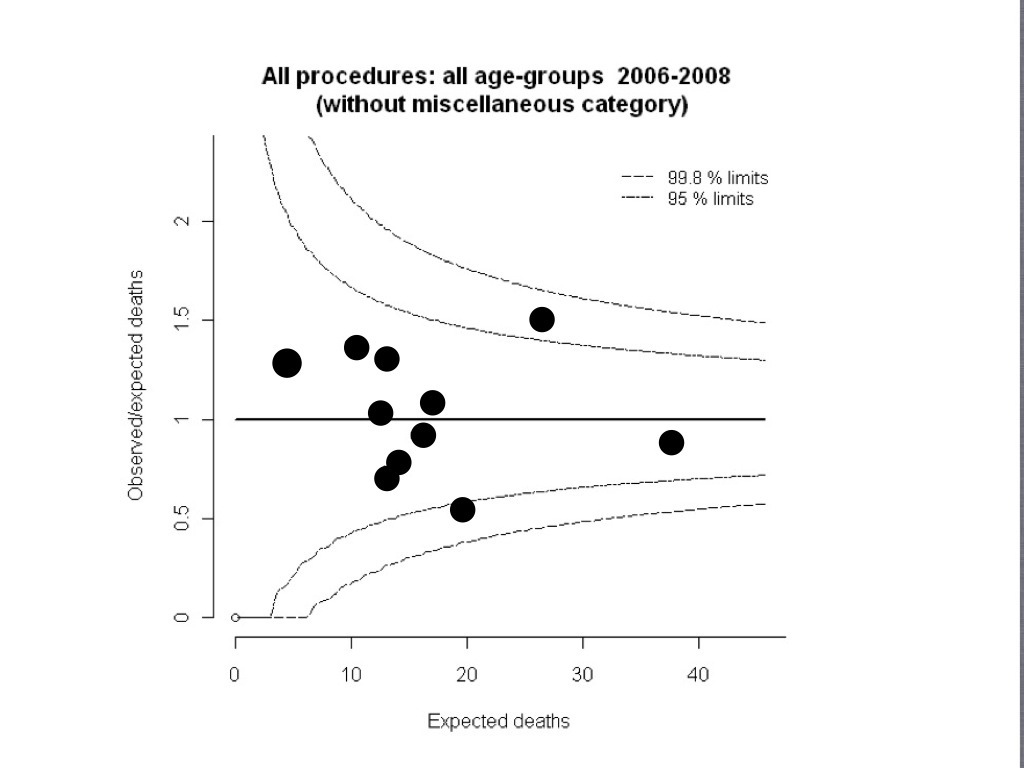
The other important thing to recognise about mortality statistics – is that they are just that; statistics. As such reliability depends on sample size and confidence intervals. As a rule of thumb a condition with an expected mortality rate of 10% needs a sample size of about 200 cases before the confidence interval falls to a point where a doubling (or halving) of the observed rate can be explained by anything more than random chance. This is best illustrated graphically by the ‘funnel plot’ an example of which is below – and explained simply in this article here.
Two Stories About Mortality
Hospital A is a medium size district general hospital in a provincial town of the midlands. It is more than 30 miles from the nearest city and serves a relatively fixed population, bounded by open countryside, which is below the threshold for sustaining a comprehensive range of hospital services. It has recently successfully achieved foundation trust status by importing a new board that have railroaded a controversial savings program through that has helped make the long term finances appear sustainable. Many staff have been made redundant and staffing ratios on the wards have been reduced. Morale is low and sickness rates are high, the wards are busy with large numbers of elderly dependent patients. The hospital has always struggled with attracting high quality medical staff because of its geographical location, tenuous affiliation with a university hospital, low numbers of doctors in training and an unexciting specialty portfolio. There have been a number of recent complaints from relatives unhappy about basic standards of care on the wards – two of these have been reported in the local newspaper, with the suggestion that neglect of care was a contributing factor in the deaths of patients. The HSMR for this hospital is 127, the second highest in the country.
Hospital B is a large university trust in a major city in England. It has a number of highly specialised tertiary services for which it has a national and international profile. One of these is complex paediatric congenital heart surgery, for which it is one of only a dozen centres in the country. The unit is celebrated locally and has a loyal following of patients and their parents who have received treatment there. The surgeons often having taken on cases others have refused and in doing so averting what would have otherwise been certain death. The unit has been threatened with closure as a result of a national consultation on re-configuration of paediatric cardiac surgery – aiming to concentrate services from eleven to seven centres. The local newspaper is outraged and has rallied support from local and national celebrities and politicians to keep the unit open. The staff are highly motivated and capable and the surgeons have published acclaimed original research in international journals. The standardised mortality ratio for paediatric heart surgery at the hospital is 200, the second highest in the country.
Beside ourselves jumping to conclusions
Death is a powerful word – just reading it on the page is likely to result in both a physiological response (increased heart rate, blood pressure and dilated pupils) and an emotional one (fear, disgust and aversion). These responses are usually rapidly attenuated by the rational part of the brain (system 2), however the alertness brought on by the physiological and emotional response will have activated system 1 – your innate, intuitive, fast thinking brain will be in overdrive (primed to deal with the ‘threat’) as will all of its biases.
So what are you thinking about the two (completely fictional) hospitals above? At whom is your outrage directed in each of the stories? Would you allow your grandmother to have her fractured hip treated at hospital A? Would you recommend a friend have their child with VSD be operated on at hospital B? Are you angry with the hospital or the system that is trying to close it down?
Before you answer those questions it is worth taking some time to reflect on how your thinking may be being manipulated:
This last point is particularly pertinent to my two stories, because they both have one thing in common – they are both ‘small’ – one is a small district general hospital, the other is a small highly specialised unit. Their outlier status is almost certainly more to do with their smallness than their quality of care, although this should not be ruled out of hand either.
A Prejudice Fuelled by a Bias
Buried within the shrill, insistent and pervasive criticism of the Mid-Staffordshire Hospital Trust is a deeply held prejudice amongst leaders and policy makers within the health service; big is good small is bad. This prejudice is affirmed and re-affirmed on a regular basis by the apparent evidence of poor performance and outcomes – the smaller you are the more likely you are to find yourself at the top or bottom of a league table. The fact that this phenomenon is a mathematical inevitability is either not recognised or overlooked because it suits ‘the system’, it provides supporting ‘evidence’ that not only are small services expensive they offer poor value as well.
Big of course is not inevitably good either – one of the advantages of being a large institution is that you experience the converse of the ‘small outlier’ phenomenon in your outcome statistics, you are generally a ‘large average’ institution, you routinely find yourself (reassuringly) ‘in the pack’. Reassured you shouldn’t be though – hiding in every large institution’s aggregated outcome statistics will be some great performance and some dreadful. Some of the shrillness of the commentary will be disguising the fear that every leader holds – that within their own institutions are lurking little bits of Mid-Staffs.
The mortality figures at Mid-Staffs were probably the least surprising and least relevant part of the story. A great deal did go wrong at the hospital – particularly at board level where there is much evidence that it was the victim of ‘group think’ – almost all of the pre-requisites and risks were present and it would appear none of the defences. A topic I think I will come back to in a future blog.
Outcome Statistics – A Health Warning
As an intensivist I have lived and breathed outcome statistics (I’ve even written a book chapter on that subject as well). They are incredibly useful tools, but they take time to become useful, it took the intensive care community a good decade to start to understand the meaning and utility of the statistics produced by ICNARC. What is absolutely certain is that they can never tell the whole story, and in fact when constructing a story about the quality and safety of a service they should simply act as pointers for further and deeper investigation. There are many nuances even to the apparently binomial outcome of mortality that have to be unpicked and understood before coming to any meaningful conclusion. I thoroughly welcome the fact that mortality as an outcome has found the spotlight – it used to frustrate me immensely as a clinical director that I was held to account more for my financial balance than the number of deaths on my unit. But in finding the spotlight it has been picked up, sensationalised and put to political use – not just by the press but by people within the health service that should know better.
The conversation about mortality in hospitals needs to be held in an intelligent, un-frenzied, non-political and unprejudiced environment – we risk doing immense harm to fragile services if we don’t.
When thinking about mortality it is vital that we think slow.


Roger – This is an excellent piece and should be read by every ‘leader’ in Healthcare
HI Roger, This is an interesting article linking failings of HSMRs with failings of us as humans. Just a couple of things. Excluding palliative care (Z5.15) from HSMR is less than one line of code and as far as I am aware was excluded from Mid Staffs analysis. In fact, it was also discovered that some hospitals were exploiting this ‘loop hole’ by ‘coding themselves to excellence’. In any case this is a surmountable problem. On the issue of regression to mean, I think that was raised by Lilford and Mohammed who calculated that for a hospital to be definitely be ‘worse’ they would have to have number of excess deaths in the range of 15% deaths. They laughed. It seemed a very high number but we didn’t know this hypothetical probability was reality in many parts of England.
Coming to the human side of the argument. Are we going to be able to deal with data in a “intelligent, un-frenzied, non-political and unprejudiced environment”? We know that the media loves league tables, people love scores, governments are opportunistic. So what are we going to do? Some have argued that this data should not be made public, suspiciously they seem to be the same people who said HSMR should not be measured. The attitude of some can be summed as ‘you dont need facts, you cant deal with facts’.
The answer to all this is that we must. It is unethical to pretend that all doctors are equally good and all hospitals are as good as another. If we have to balance the rights of a doctor/hospital to not be named and shame against rights of patients to know, I know which side I am going to come out.
HSMR is not an ideal indicator which has been said in several ways over the last month or so:
(in a measured way by Paul Taylor here http://www.lrb.co.uk/v35/n07/paul-taylor/rigging-the-death-rate,
in a geeky way by Simon here http://www.saasoft.com/blog/?p=2753 and
using all the daily mail techniques here: http://skwalker1964.wordpress.com/2013/03/)
but it has something very powerful going for it which is that it can be collected using existing indicators in other words, it does not require the co-operation of the ‘measured’ to measure. Any indicator which did would fail. Things like ICNARC take decades to set up and do not release data to the public and most of the trustees are the ‘measured, I am sure they are honourable people and are honest but just like the PCC made up of editors of newspapers watching over editors of newspapers such setups are not something patients or general public has a lot of trust in.
I am optimistic by disposition so I hope that one day I will wake up in a world where:
1. Those who are not happy with HSMR, instead of telling us everyday how and why HSMR is so bad will propose a much better system which has the positive characteristics of HSMR but not the negative ones.
2, Instead of saying ‘people shouldnt have facts, they cant deal with facts’ will start asking how do we present facts in a way that more people will be able to deal with them. There will always be people who cant deal with life, I know some who can’t operate a wall radiator but that does not mean we stop heating homes.
3. People will stop buying the daily mail and move to reading the guardian (I think I went to far.)
Thanks for writing this piece, I learnt a lot. I will visit more often.
I don’t mean to imply that because HSMR is flawed that we shouldn’t use it – or an improved alternative – as one of a raft of measures of quality and outcome. Quite the reverse, I am an advocate of performance managing value (quality+outcome/cost) which requires as rigorous approach to measures of quality and outcome as we have to finances, as well as alignment of costs and outcome (as is implied in Simon’s blog). My main message is that people who should know better have abused both the statistics and the psychology for political purposes, which ultimately will not serve the interests of patient safety.
I agree with you that data was cynically abused for political purposes and it is shameful and I agree that it may not be good for advancing the cause of patient safety. But the greatest danger to patient safety remains the same from Bristor to MidStaffs, the intransigence of the medical profession to accept that the time for being a closed system is over. Of the three links above which one do you think is the most circulated by the medical community? The most misleading, factually inaccurate, inflammatory piece which has the headline claiming that no one may have died unnecessarily at Mid Staffs. Not the other two which are the sensible option.(I am still waiting for Clare Gerada to tweet either of the the other two).
We know very well that there are others which are nearly as bad as Mid Staffs and we will find out more in the next few months, government will do what it does and medical profession will do what it does. But it is the patients who will die needlessly.
Dear Roger
Just to update your readership, Dr Foster’s Mortality Comparator enables trusts and commissioners to view and understand the Summary Hospital-level Mortality Indicator (SHMI) and SHMI adjusted for Palliative Care, to show how it compares to the Hospital Standardised Mortality Ratio (HSMR).
I think SHMI is an improvement over HSMR and should address some of the worries about “patients dying needlessly”. I have always felt amused by this rhetorical statements and statements demonstrating utter failure to understand GCSE level statistics when people like a recent former health secreatry promised to investigate “why 50% of the hospitals are below the median” which she thought was ‘unfair to the patients treated there’!!
Rahul
Dear Roger – I agree with your first commentator that this should be read by every ‘leader’ in Healthcare. You have very nicely brought out the cognitive biases that colour our understanding of ‘evidence’. From my interdisciplinary pursuits, I thoroughly enjoyed your idea of ‘econs’ (what we call the Homo economicus) and ”humans’ (what we call the Homo sapiens)…..however there is a third category we recognise on those terms, specimens of which are abundantly available in today’s rich (‘developed’) world and the industrialised parts of the poor (‘developing’) world, which we call the Homo ludens (Latin: ludus=game). The Homo ludens self generally behaves or thinks it behaves like your ‘econs’ (rational, consistent, logical, ideal economic agents that always make the ‘right’ choice) but just for the sake of the game, with no sense of context, perspective or history….As several generations of linguistic philosophers from Bhartrihari in ancient India to Wittgenstein in modern Germany have taught us, context is everything in understanding meaning…..